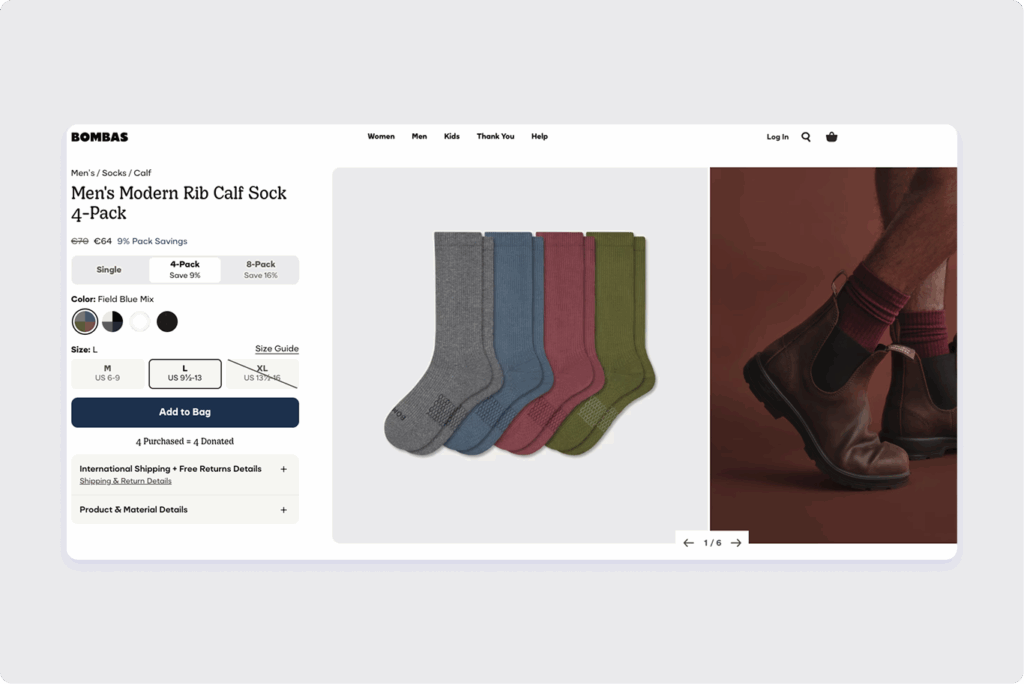
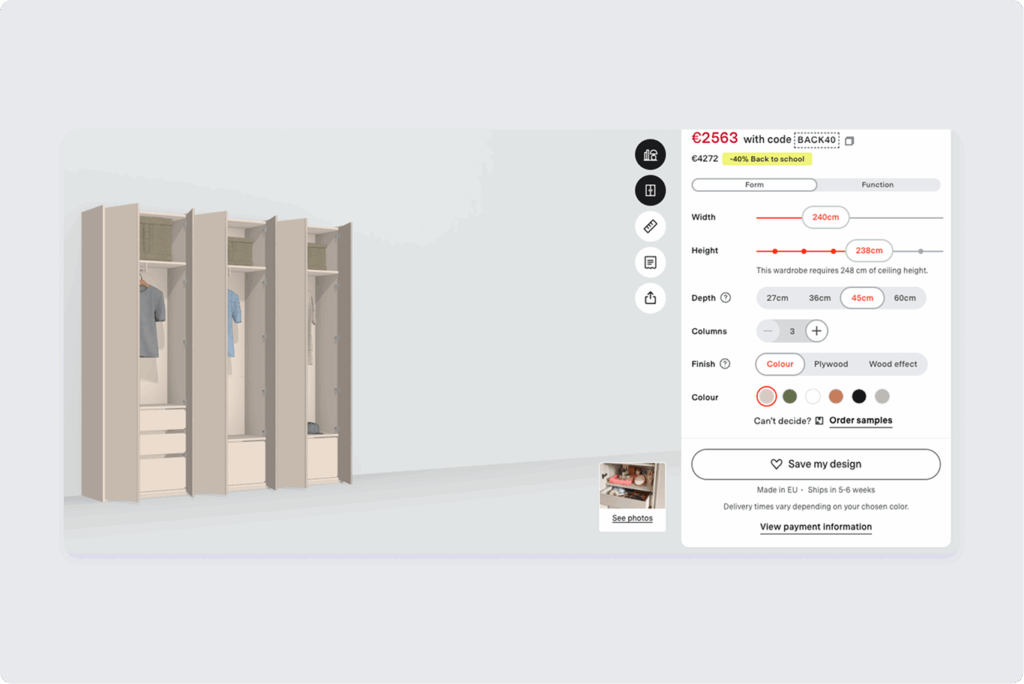
Shopify merchants rely on custom price calculators to simplify complex pricing. But behind every customer calculation lies something even more powerful. It is the data that reveals preferences, trends, and buying signals.
While you’re focused on the convenience factor, your calculator is quietly collecting intelligence about what customers really want, where they get stuck, and how pricing affects their buying decisions. Smart merchants are using this hidden data to make better inventory choices, craft targeted promotions, and even discover new product opportunities through Shopify pricing insights.
Here’s how to use custom price calculator analytics to uncover actionable sales intelligence for your Shopify store.
The data your calculator collects (and why it matters)
Every time someone configures a product in your calculator, they’re essentially voting with their clicks. They’re telling you their preferred sizes, materials, quantities, and price sensitivity, all without filling out a survey.
Tracking which combinations they use most often provides clear Shopify product pricing data about demand.
Take Sarah, who runs a custom sign shop, for example. She noticed that 60% of her calculator interactions involved 24×36 corrugated plastic signs, even though she featured dozens of size options prominently. That data helped her negotiate better pricing with suppliers, adjust her homepage layout, and create a “most popular” bundle that increased her average order value.
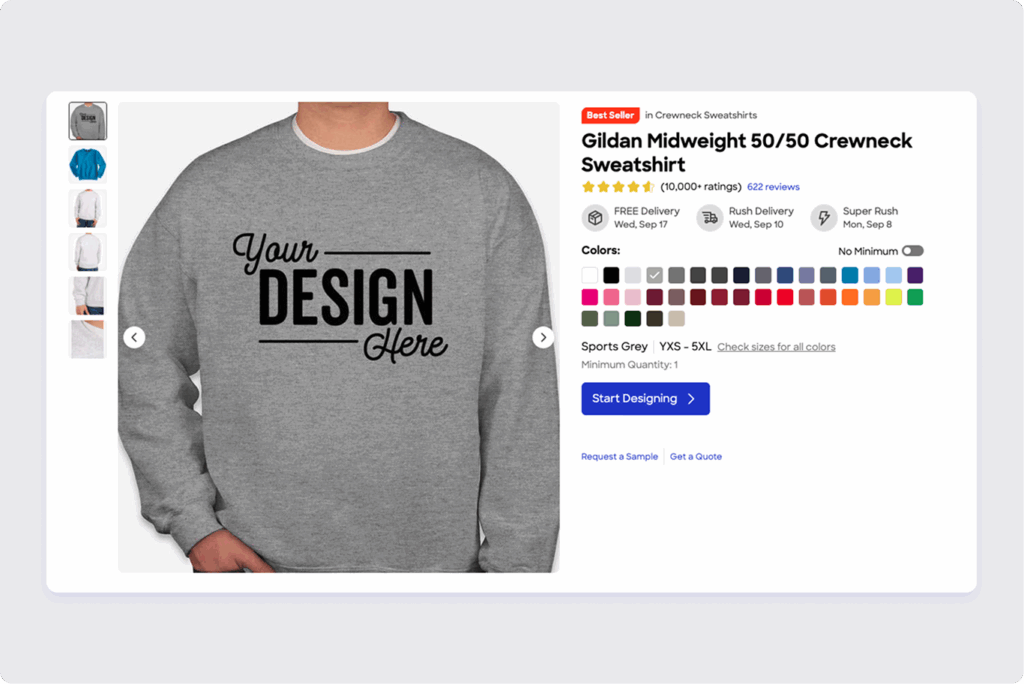
Or consider Mike’s custom apparel store. His custom price calculator analytics revealed that customers frequently uploaded files for personalization but rarely completed orders above $180. Two insights from one data point: strong demand for custom work, but a clear price ceiling where people bail out.

Reading the signals: what to track and why
Your calculator generates several types of actionable data, each with different business implications. The key is knowing which custom price calculator metrics actually drive business decisions and which ones are just noise.
Formula and input combinations reveal your customers’ true preferences in ways traditional analytics can’t match. When customers repeatedly select the same material, size, or service combinations, they’re voting with real purchasing intent. A wallpaper merchant might discover that 45% of all calculations involve textured vinyl in residential widths, while commercial smooth vinyl barely registers 8% of interactions.
This data is more valuable than website clicks or page views because it shows committed interest. Someone configuring a $300 custom order is fundamentally different from someone just browsing product pages. Track these patterns weekly to spot emerging trends before they become obvious. Maybe customers started requesting larger formats in March, signaling demand you could capitalize on before competitors notice.
Look specifically for unexpected combinations that customers create repeatedly. A custom furniture maker discovered customers frequently paired premium wood species with budget hardware options, a combination not offered in their preset packages.
Price drop-off points function like a psychological x-ray of your market. Every abandoned calculation represents a moment when perceived value collapsed under actual cost. These moments cluster around specific price thresholds that reveal deep customer psychology.
Track abandonment at different price levels. You’ll often find customers bail out at round numbers where they’ve mentally set budget limits. But the really valuable insights come from tracking the specific inputs that trigger abandonment. Maybe customers accept $180 for premium materials, but abandon at $185 when expedited shipping gets added. That $5 difference reveals shipping cost sensitivity that could reshape your fulfillment strategy.
Don’t forget to track the recovery attempts. Customers who configure multiple variations before leaving are different from those who abandon immediately. The first group is genuinely interested but looking for the right price point. The second might be comparison shopping or just exploring.
Upload patterns and file interactions tell sophisticated stories about customer intent and market maturity. High file upload rates show customers who’ve moved beyond browsing to active project planning.
Track upload success rates alongside conversion rates. Customers who successfully upload files convert at dramatically higher rates because they’re emotionally invested in their specific project. But if upload success rates are low, you’ve found a technical barrier killing sales. Maybe your file size limits are too restrictive, or your accepted formats don’t match what customers typically have.
Time-based trends show seasonal patterns and emerging preferences. Maybe winter months see more indoor signage requests, or summer brings a spike in outdoor material selections.
Beyond obvious seasonal patterns, look for micro-trends that reveal changing customer behavior.

Turning data into revenue: four immediate actions
Once you start tracking this data, the business applications become obvious. Here’s how to convert Shopify pricing insights into revenue.
Optimize your inventory strategy. Stock heavily in the combinations customers configure most often. If 40% of quotes involve a specific material and size combo, make sure you never run out. Conversely, expensive specialty options that rarely appear in calculations might be candidates for drop-shipping or special order only.
Redesign your pricing structure. When you spot consistent drop-off points, test new pricing tiers right below those thresholds. Sarah’s sign shop found customers often abandoned quotes at $250, so she created a $199 package that captured many of those lost sales. Sometimes the solution isn’t lowering prices, it’s restructuring them to hit psychological sweet spots.
Create targeted promotions. Instead of blanket discounts, offer promotions on the exact configurations customers request most. If your data shows heavy interest in premium materials but low conversion, try a “upgrade to premium for just $20 more” campaign. The specificity makes promotions feel personal rather than generic.
Discover hidden product opportunities. Pay attention to configurations customers create that you don’t actually offer. Maybe they’re repeatedly trying to build a size you don’t stock, or combining materials in ways you hadn’t considered. These “failed” configurations often represent unmet demand worth exploring.

Making it actionable: your 30-day data challenge
Most Shopify merchants never look at their custom price calculator analytics because they don’t know what to look for. Here’s a simple 30-day process to change that.
Week one: Export your calculator data and identify your top 10 most-requested configurations. Are you stocking appropriately for these popular combinations?
Week two: Map your price drop-off points. Where do customers consistently abandon their carts? Look for patterns around specific amounts, shipping costs, or complexity levels.
Week three: Analyze your seasonal trends. How do customer preferences shift month to month? What does this tell you about upcoming inventory needs?
Week four: Experiment with one change based on your findings. Maybe it’s adjusting a pricing tier, featuring a popular configuration more prominently, or testing a targeted promotion.
The compound effect
The real power of calculator analytics is in the compound effect of making data-driven decisions consistently over time. Each optimization teaches you more about your customers, which enables better future decisions.
Shopify Merchants who review their custom price calculator data monthly report significantly better inventory turns, higher conversion rates, and more successful promotional campaigns.
Your price calculator is already collecting this intelligence. The question is whether you’re smart enough to use it. While your competitors are still guessing what customers want, you could be making decisions based on exactly what they’re telling you through their actions.
Start looking at your calculator as more than a pricing tool. It’s actually a window into customer behavior, market demand, and hidden opportunities. The Shopify merchants who recognize this first will have a massive advantage over those who just see it as a convenience feature.
The Apippa Custom Price Calculator not only handles complex pricing with ease but also captures the data behind every calculation. For Shopify merchants who want to turn pricing activity into a source of growth insights, using calculator analytics is the natural next step.
